
ADB Debugging
The process of debugging webpages in a mobile browser via ADB (Android Debug Bridge) on a computer is actually quite straightforward. In simple terms, it involves establishing a bridge from the mobile browser's internal kernel to Chrome Developer Tools on the computer.
Here are the detailed steps:
Step 1: Prepare the mobile device (enable developer mode)
You need to make your phone in a "debuggable" state.
- Enable Developer Options: Navigate to your phone's
Settings->About Phone-> continuously tap onBuild Number7 times until you are prompted that you have entered developer mode. - Enable USB Debugging: Return to Settings, navigate to
System/Additional Settings->Developer Options, find and enable USB Debugging. - Connect to the computer: Connect the phone to the computer using a data cable. When the "Allow USB debugging?" dialog box pops up on the phone, tick "Always allow" and click "OK".
Step 2: Prepare the computer (environment detection)
Ensure that your computer has the ADB tool installed.
- Open the terminal (CMD/PowerShell for Windows or Terminal for macOS).
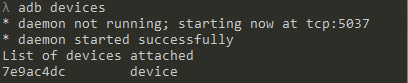
- Enter the following command to confirm that the phone is connected:bash
adb devices - If you see a sequence number followed by the word 'device', it indicates a successful connection.
Step 3: Start debugging (Chrome Inspect)
This is the most crucial step, utilizing Chrome's built-in tools for remote connection.
- Open Chrome Browser (or any browser based on the Chromium engine, such as Edge, Xiaomi/Huawei's built-in browser, etc.) on your phone, and open the webpage you want to debug.
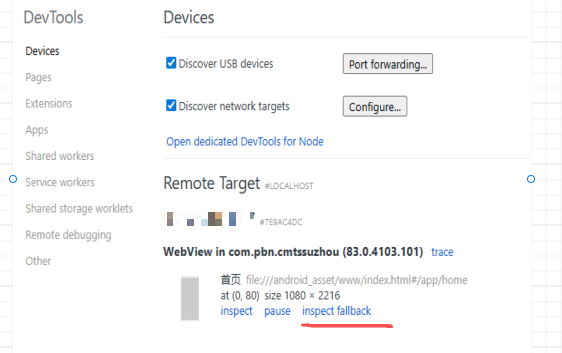
- Enter the following in the address bar of the Chrome browser on your computer:
chrome://inspect/##devices - You will see your phone model listed under Remote Target, along with all the web tabs currently open on your phone.
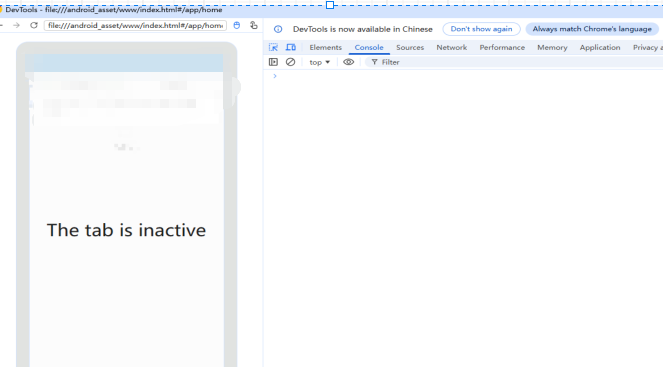
- Click the inspect button located below the corresponding tab.
cordova run android --device --target=7e9ac4dc
When you run cordova run android, Cordova defaults to the --debug compilation mode (unless you manually add --release).
- Includes debug signature: It uses the default debug key of the Android SDK.
- Enabled remote debugging switch: As mentioned earlier, it will automatically execute
setWebContentsDebuggingEnabled(true)in the native code of the app. - No code obfuscation: Your JS code and HTML are all original and authentic, making it easy for you to view.
Although the app runs in Debug mode, the cordova run command itself is only responsible for deployment.
- It cannot break: After running this command, your terminal usually stops outputting detailed logs. You cannot write
step overin the command line or view variable values. - It cannot be modified in real-time: If you notice that the buttons on the page are misaligned, you cannot make changes to them through the command line.
That's why you need chrome://inspect.
The complete "Debug Link" model
| Stage | Action | Command/Tool | Purpose |
|---|---|---|---|
| Launching Phase | Compile + Install + Launch | cordova run android | Display the icon of this App on the phone and run it. |
| Observation stage | Monitoring + Error reporting + Real-time modification | Chrome DevTools | Like a scalpel, it allows you to delve into the internal logic of the app. |
If you don't want to open Chrome, but just want to check if the app has crashed, or want to view the output of console.log, you can use it in conjunction with Logcat:
## Execute after running cordova to view phone logs in real time
adb -s 7e9ac4dc logcat | grep chromium
This command will filter out all logs from Webview (browser kernel).
Debug Build
For security reasons, the Android system has disabled the remote debugging function of WebView by default.
- Debug Build: When you develop a Cordova, Ionic, ReactNative, or hybrid native app, the Debug version compiled by default has the debug switch turned on.
- Release Build: When the developer of the app you downloaded from the app store packages it, they usually turn off the debug switch. At this time, you won't be able to see them in
chrome://inspect